Didactic proposal
Interactive geography
Pedagogy of Geointeractiva tools

Why Geointeractiva
Geointeractiva is an application designed to encourage interactive learning, away from a memoiristic curricular model. An adaptive digital tool that promotes creativity in the field of geography and cartography, as well as in other disciplines.
Offering critical and creative interaction, Geointeractiva is a working online environment, where creativity and critical judgment enable an active complicity between users, information, and maps.
The tools of Geointeractiva allow the user to make personal use of the maps and available work items. The app has a rich and updated database with more than 70,000 toponyms, statistical data, graphics and multimedia content. The user can also set up and edit his own data, take it into a map, save it or even share it with other users.
The application has been mainly created from a pedagogical point of view; all the elements that compose the app have been conceived to facilitate both the learning and the teaching of the subjects. As an interactive support, the app has been made up with several content tools which allow a transversal use of the contents, in order to enhance a comparative experience within the numerous areas of human geography.
Geointeractiva is tailor made for anyone with an interest in interactive map environments. We are continuously adding to the existing tools and functions to keep improving the user experience.
Our cartography has been mainly designed from an scholastic understanding of its usage, however, experts and professionals may also find the app as a convenient tool. The design of the application menus and map elements offers students and teachers an easy and intuitive way of learning and teaching human geography.
Geointeractiva is an application tailored for anyone with an interest in an interactive map environment. We are continuously adding tools and functions to continue improving the user experience.
Maps for your needs
Create, edit and share your maps
The application has a Tools menu to configure and edit the maps hosted on it; draw lines and polygons, locate georeferenced markers or insert your images and styles in order to edit and personalize the map in to your needs. Geointeractiva software also allows to save and share tailored maps with other users, in the social networks, or even inserted as PDF in to personal or commercial websites.
The vector maps created by Geointeractiva are visualized using a structure of layers; each element (physical or political) can be enabled or disabled depending on the interaction desired by the user. Produce a map and combine the desired information using the layers and sublayers that will allow you to hide or show the cartographic content.
In addition to the vector maps created by the Geointeractiva team, the app allows you to import open source maps (Open Maps, Stamen, NASA, etc.) and interact with cartographic data.
Import your own data to generate graphical representations; qualitative charts (thematic maps) or quantitative charts (statistical maps), project routes to your favorite places on Earth, or recreate a multimedia presentation of your journeys. It is also possible to import or export files georeferenced in different formats (CSV / KML / GPX).
Save the session whenever you want and share it or continue from the last point you left it; The software allows the user maps to be exported in JPG or PDF.
An educational tool
Create, use and share your maps in academic and domestic environments
The various functions of Geointeractiva enhance the usability of the map with respect to the conventional printed map. That means a better experience for both professors and students. Designed with WebGL technology, the app stands out for its functionality, versatility and easy use. The option to embed Geointeractiva’s plug-in button for virtual libraries or academic intranets will also ease the user’s access to the app.
- Geointeractiva maps allow the editing and personalization of the selected zones based on the needs of the user: You can create a thematic map of a historical period with embedded multimedia tailored for your particular educational or academic needs. You can create a thematic map (indicating the membership of countries to different international organizations) of a historical period and place multimedia references so that other users can interact with a personalized map based on educational or academic needs. The application also allows multiple measurements to be made on the maps: The calculation can be done in kilometers or miles, and the change of unit of measurement can be set from the same menu.
- With support for all major operating systems (PDI/Interactive Blackboard, MS Windows, Mac OS (iOS) and Android) and web browsers (Google Chrome, Opera, Safari, Mozilla Firefox and Microsoft Edge), Geointeractiva is a web application that adapts to all types of screens (digital whiteboards, smartphones/tablets, 4k monitors, etc.), however, the app has been developed and designed since its inception for being used from computers and tablets and its use is not recommended in smaller format screens (such as mobiles) since they do not have enough space to view maps and menus of the app.
- Possibility of printing the maps both in the Screen capture mode and in template-type formats (political map, physical map) in accordance with the paper map models for easy printing. You can export and print your maps and create copies to work on them.
Features of the app
This section explains and illustrates with videos and images, one by one the available tools of the Geointeractiva app that, with the exception of the Legend, are located in the menu on the left (Tools Menu).

Layers menu
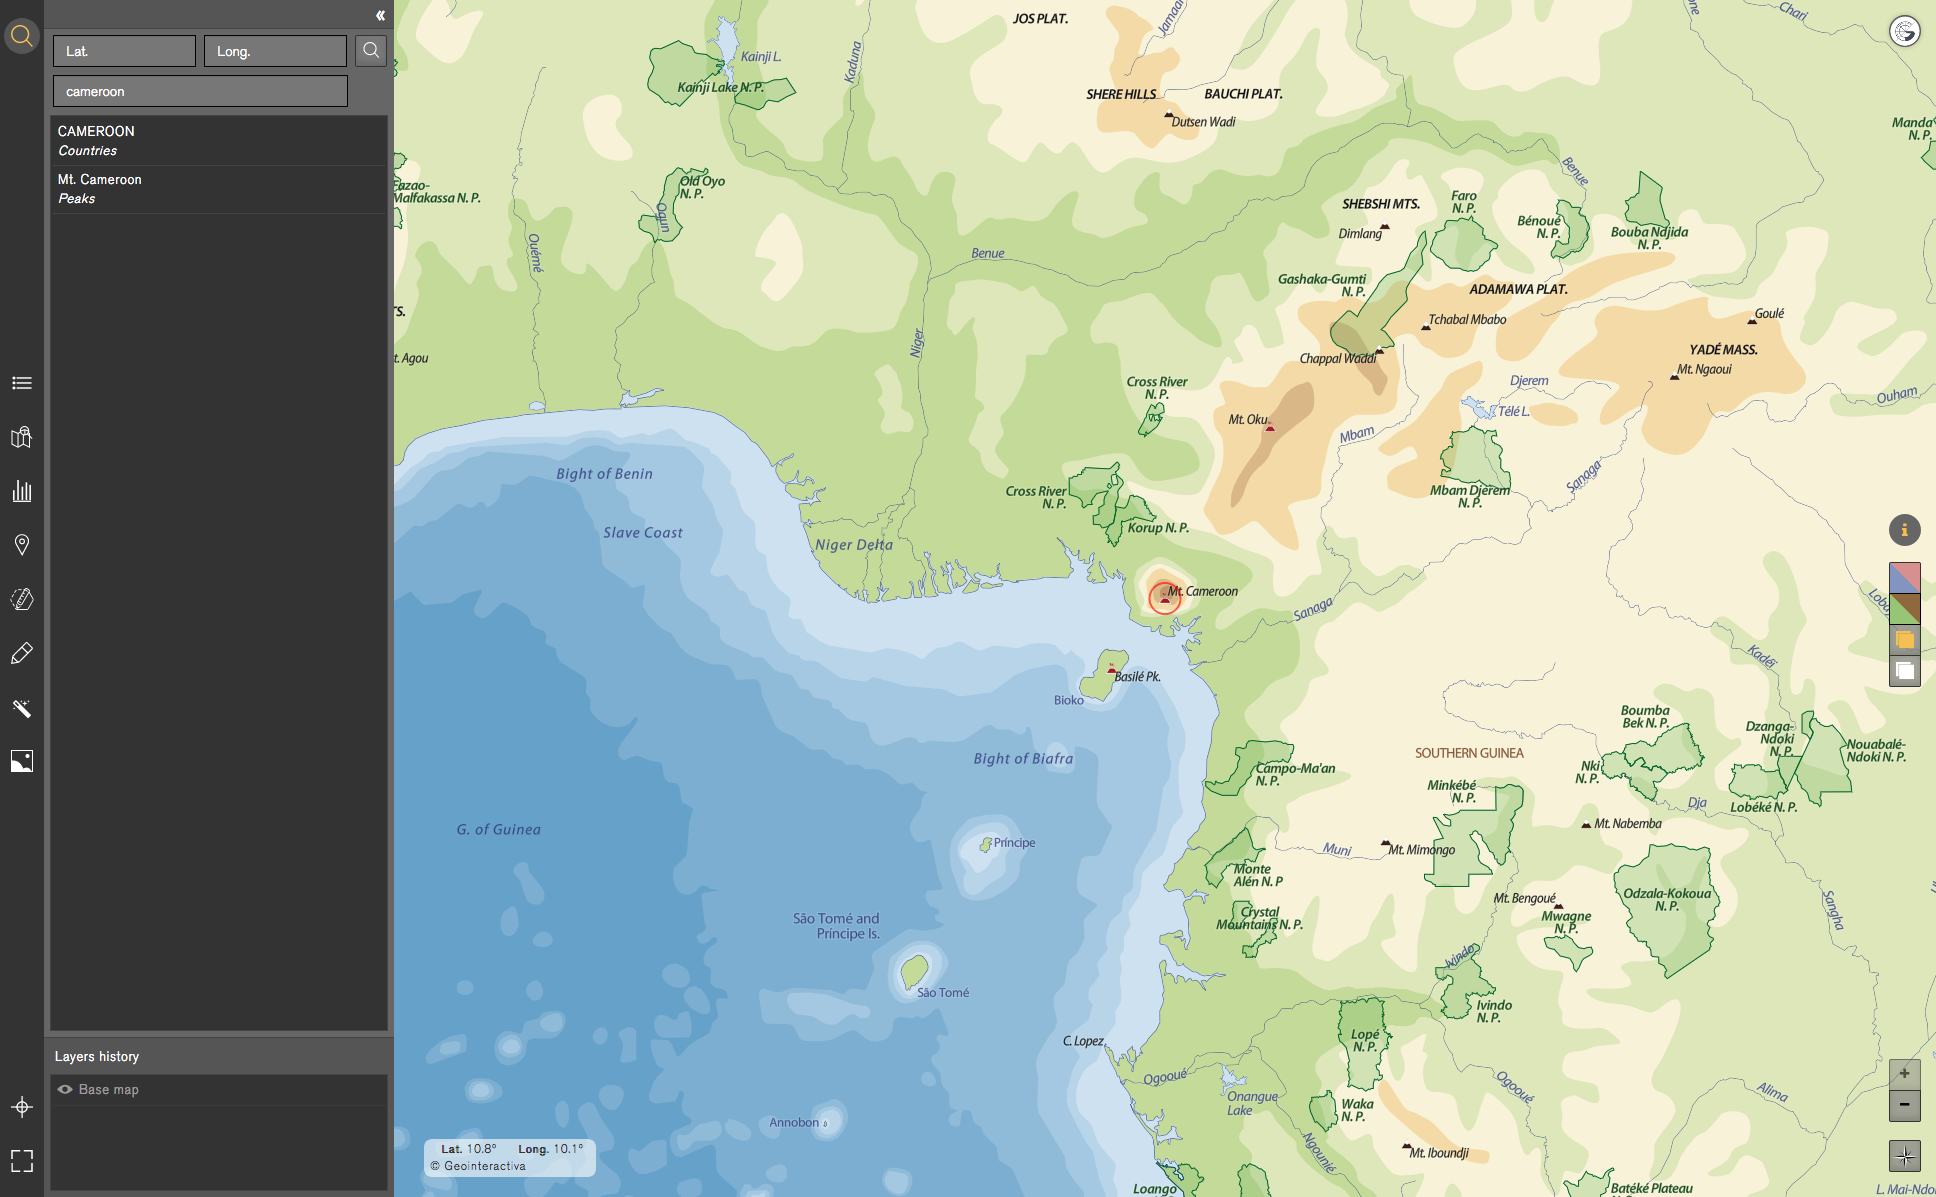
The Layers menu constitutes the body of the original cartography of Geointeractiva. Its structure has been designed for a didactical purpose, understanding how a map is build up with its cartographic layers.
The physical and political cartographic elements of the map can be combined on the basis of need. Each element (capes and tips / coastal relief) its distinguishable from its various cartographic parts (image, point, text and line). Create maps with unique combinations of layers.
By default, when accessing a map, the political version will be loaded with its combination of specific layers. Now, the user can intuitively and quickly modify the combination of layers and create a physical or political outline map, a combination of both, a map with place names only, another one with icons, etc.
Inspector button
This tool allows the user to hide or show the associated information (videos, images, audio) of certain elements of the map, such as a Markers. When activated, elements with media content will be displayed as a quick view option.
Multimedia
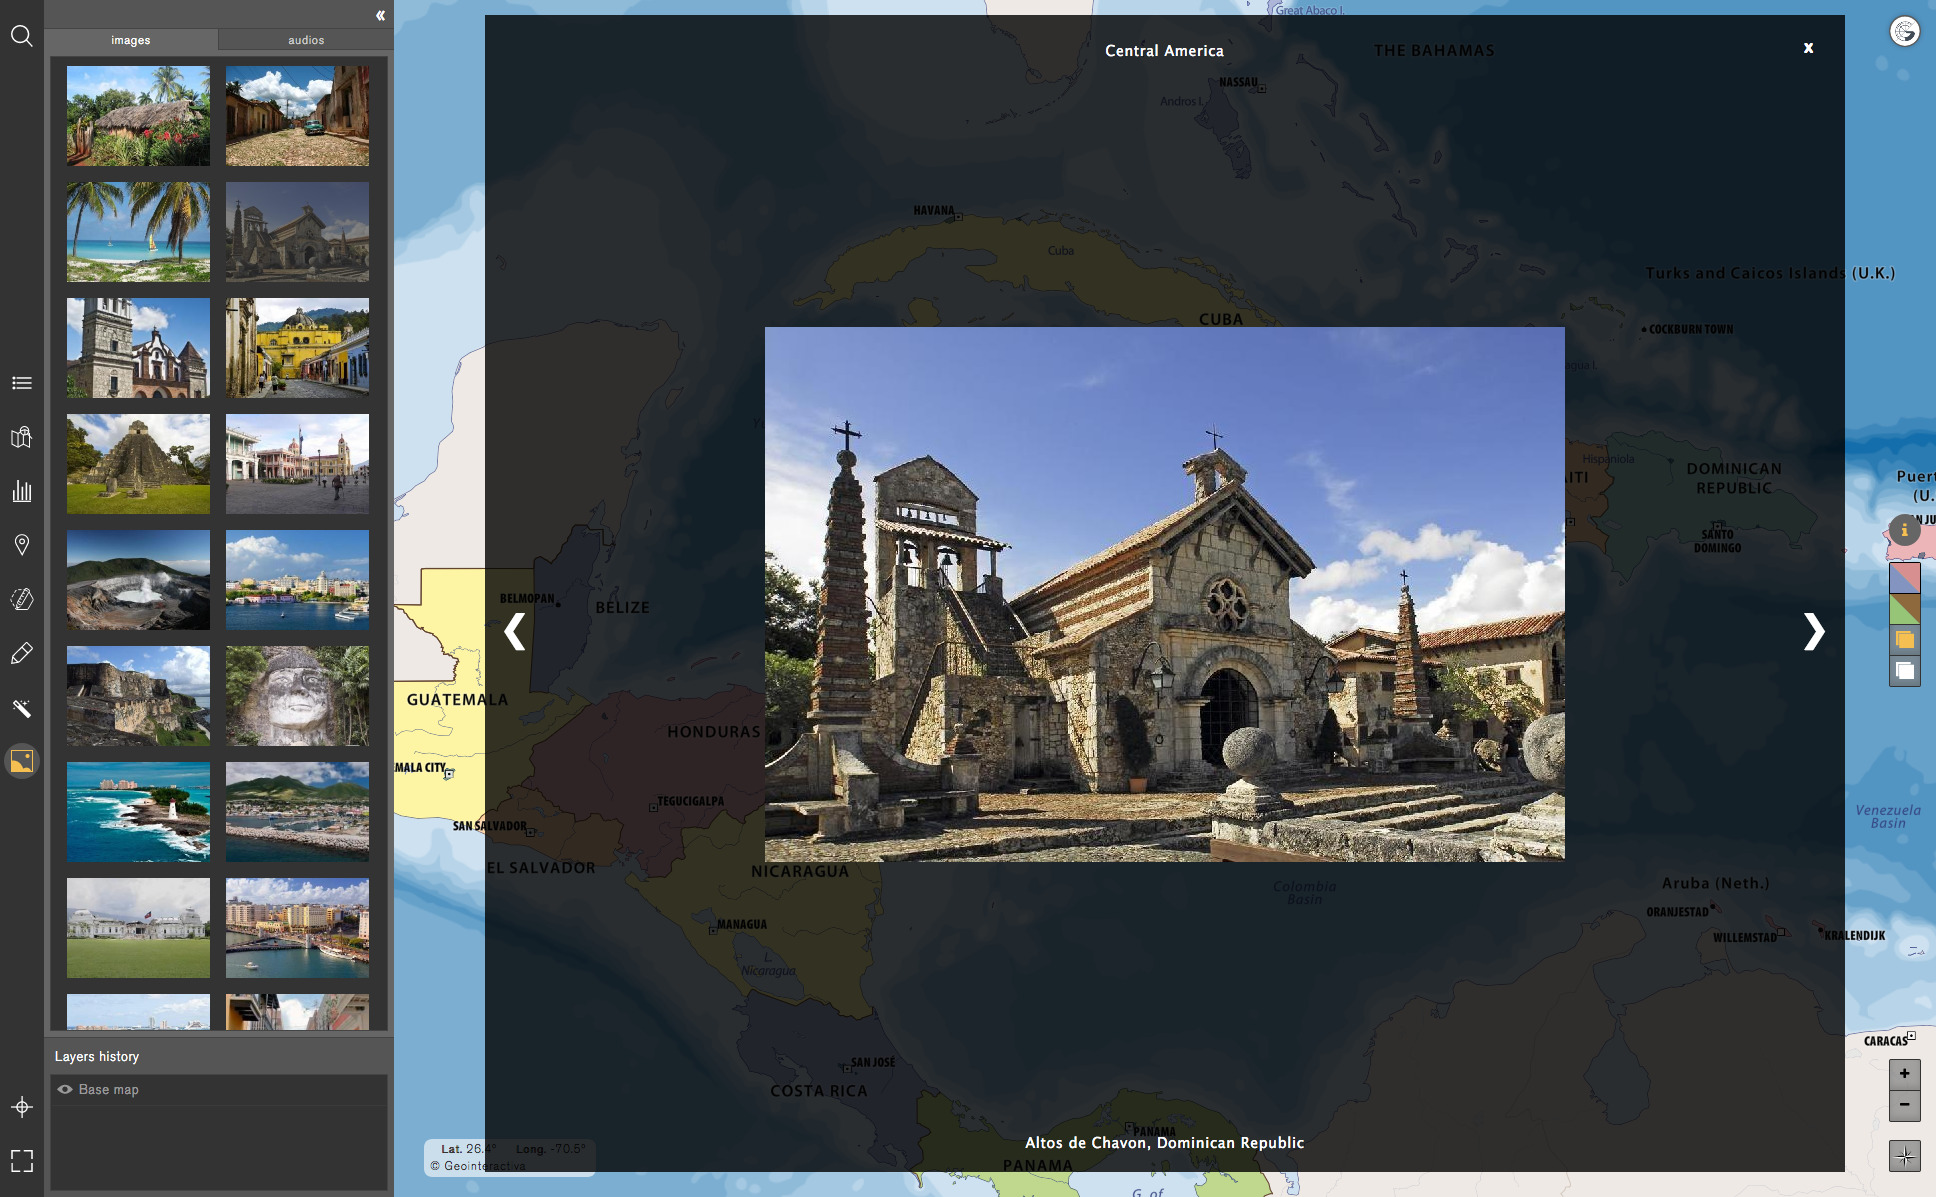
The Multimedia tool contains images offered by Geointeractiva by default and allows the user to import theirs and incorporate a title and description for each of them. Images can directly be dragged to the map and their size is editable. Default audios are also housed in this space, although at the moment the user cannot import their MP3 files.
Maps menu
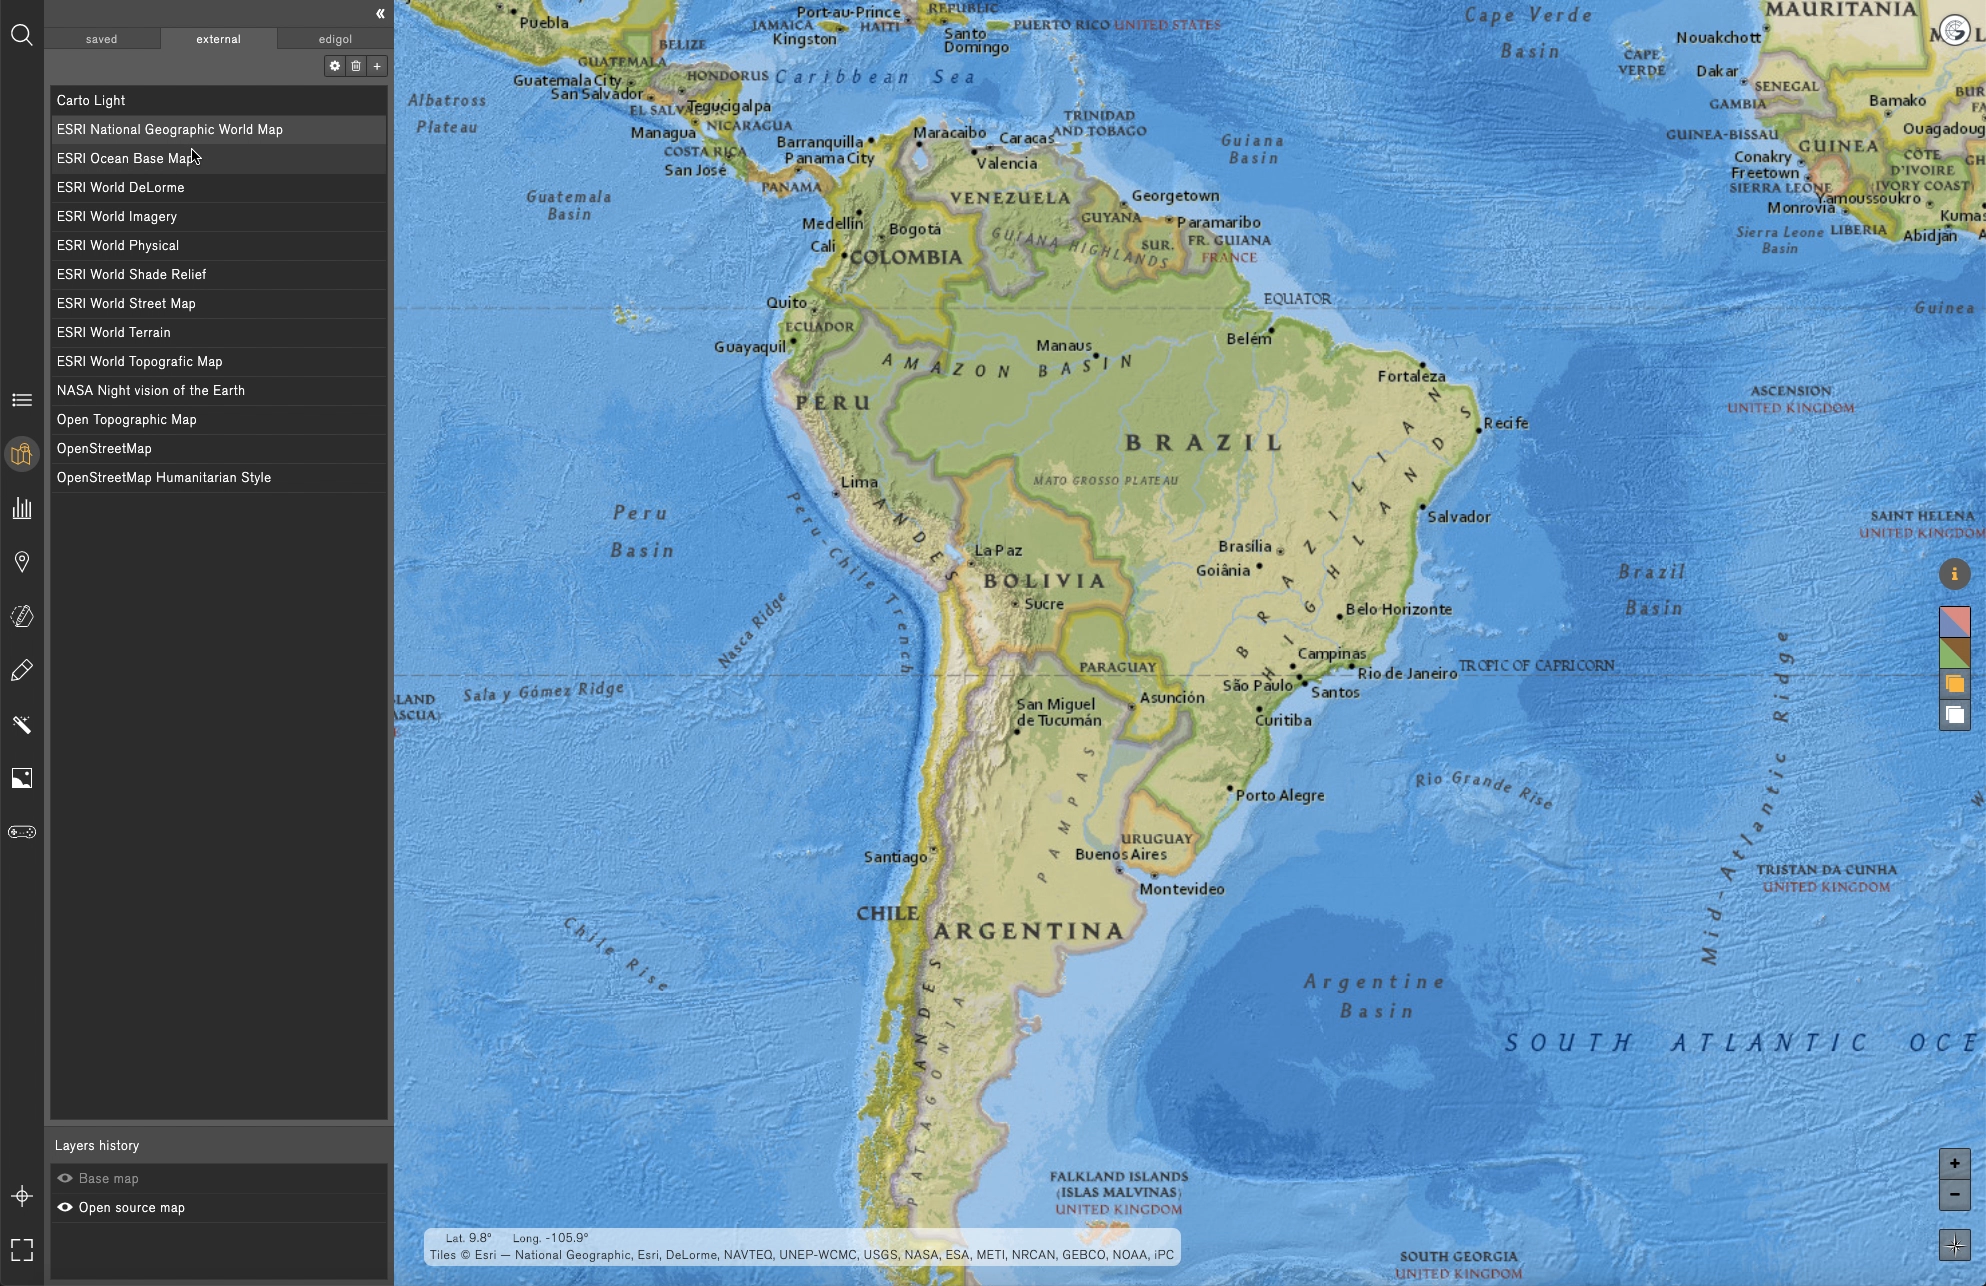
The Maps menu is the space from where the user can choose among all the available maps housed; the original maps of Geointeractiva (both the original maps and the maps created, edited and saved by the user), the Edigol Ediciones image maps, and open-source maps.
The menu shows various open-source maps, which are housed by default as an example: Open source mapping (open source mapping) is a free and collaborative mapping project worldwide. They are cartographic bases that can be shared and edited by any user, with physical and political information from all over the world until they reach a level of detail of urban planimetry (street plans) in their largest scale, using the 22 predefined zoom levels to all the land.
Note that open source layers, the user cannot overlay the planimetry layers of Geointeractiva maps. However, it’s possible to generate and apply georeferenced markers and upload them as a CSV file.
Legend
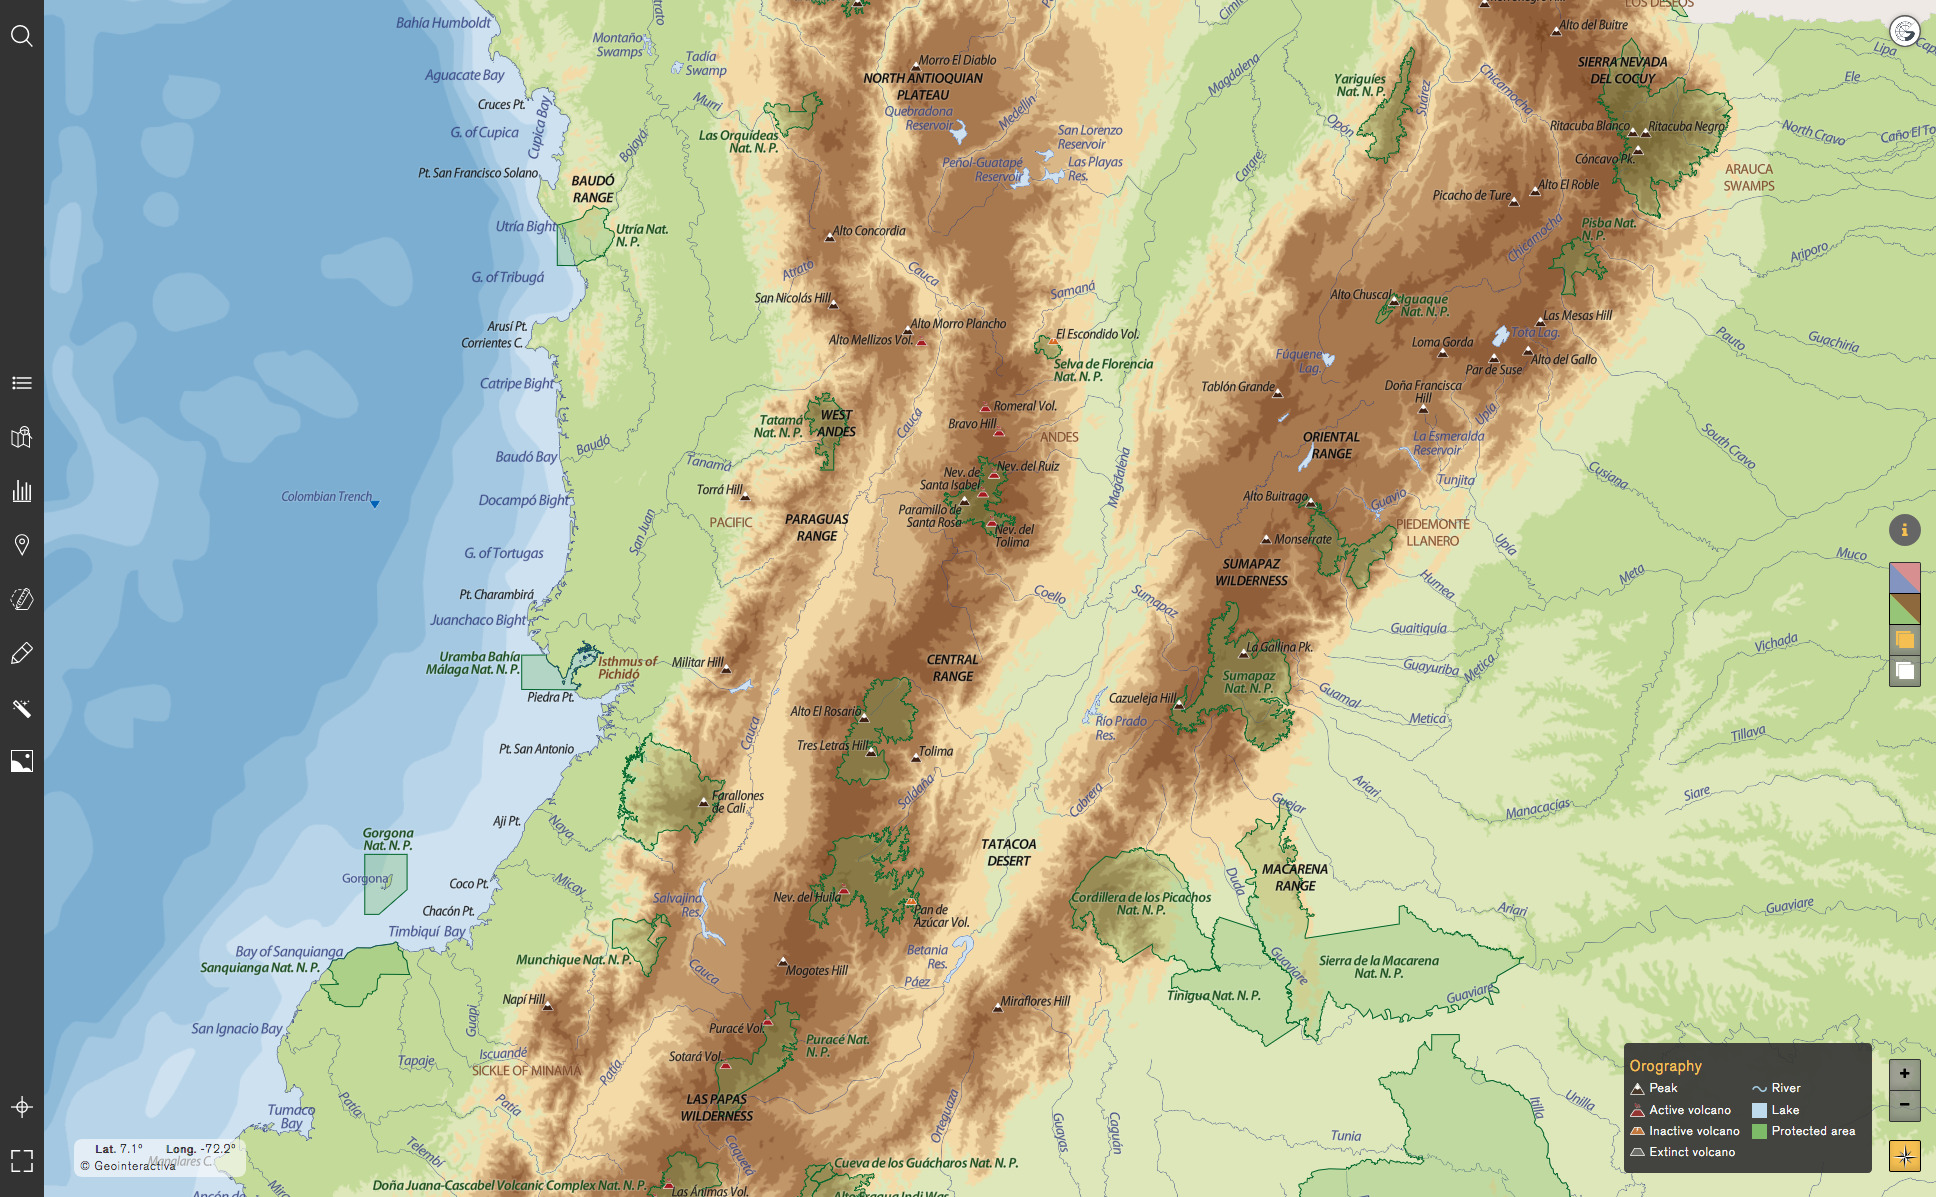
Located in the lower right corner of the map, this dynamic tool adapts to the map content so that it only shows the information of the layers and other tools (such as markers) that are currently being displayed on the map. Regarding the physical layers, the legend shows the iconography used for the different types of peaks (mountainous peaks, active and inactive volcanos, etc.) and other physical elements (rivers, protected areas, etc.). Furthermore, by activating the political layers (specifically the population layer) we visualize the different population ranges that can individually be filtered.
Measurement and Magnitude
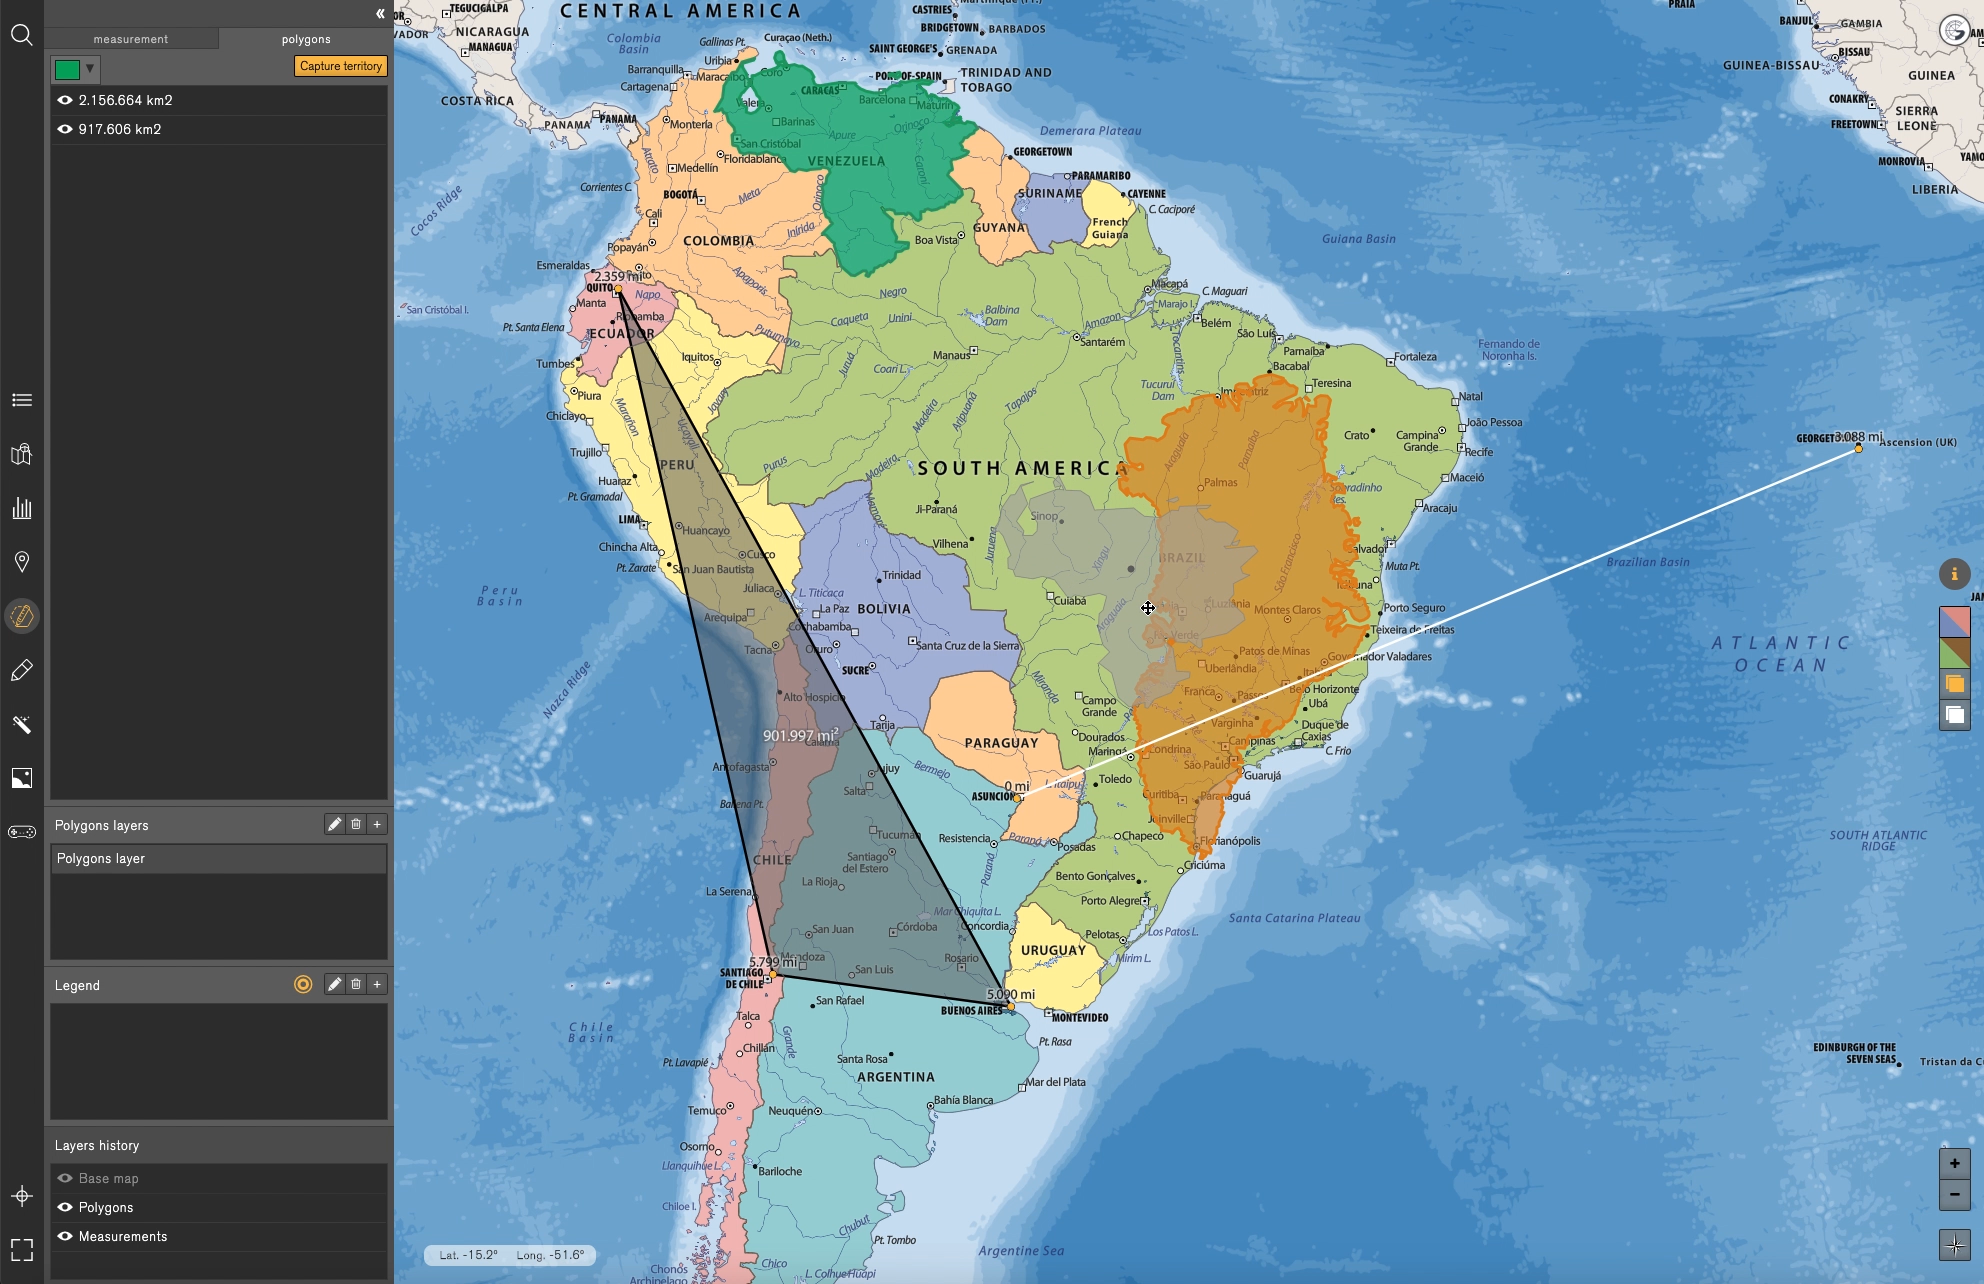
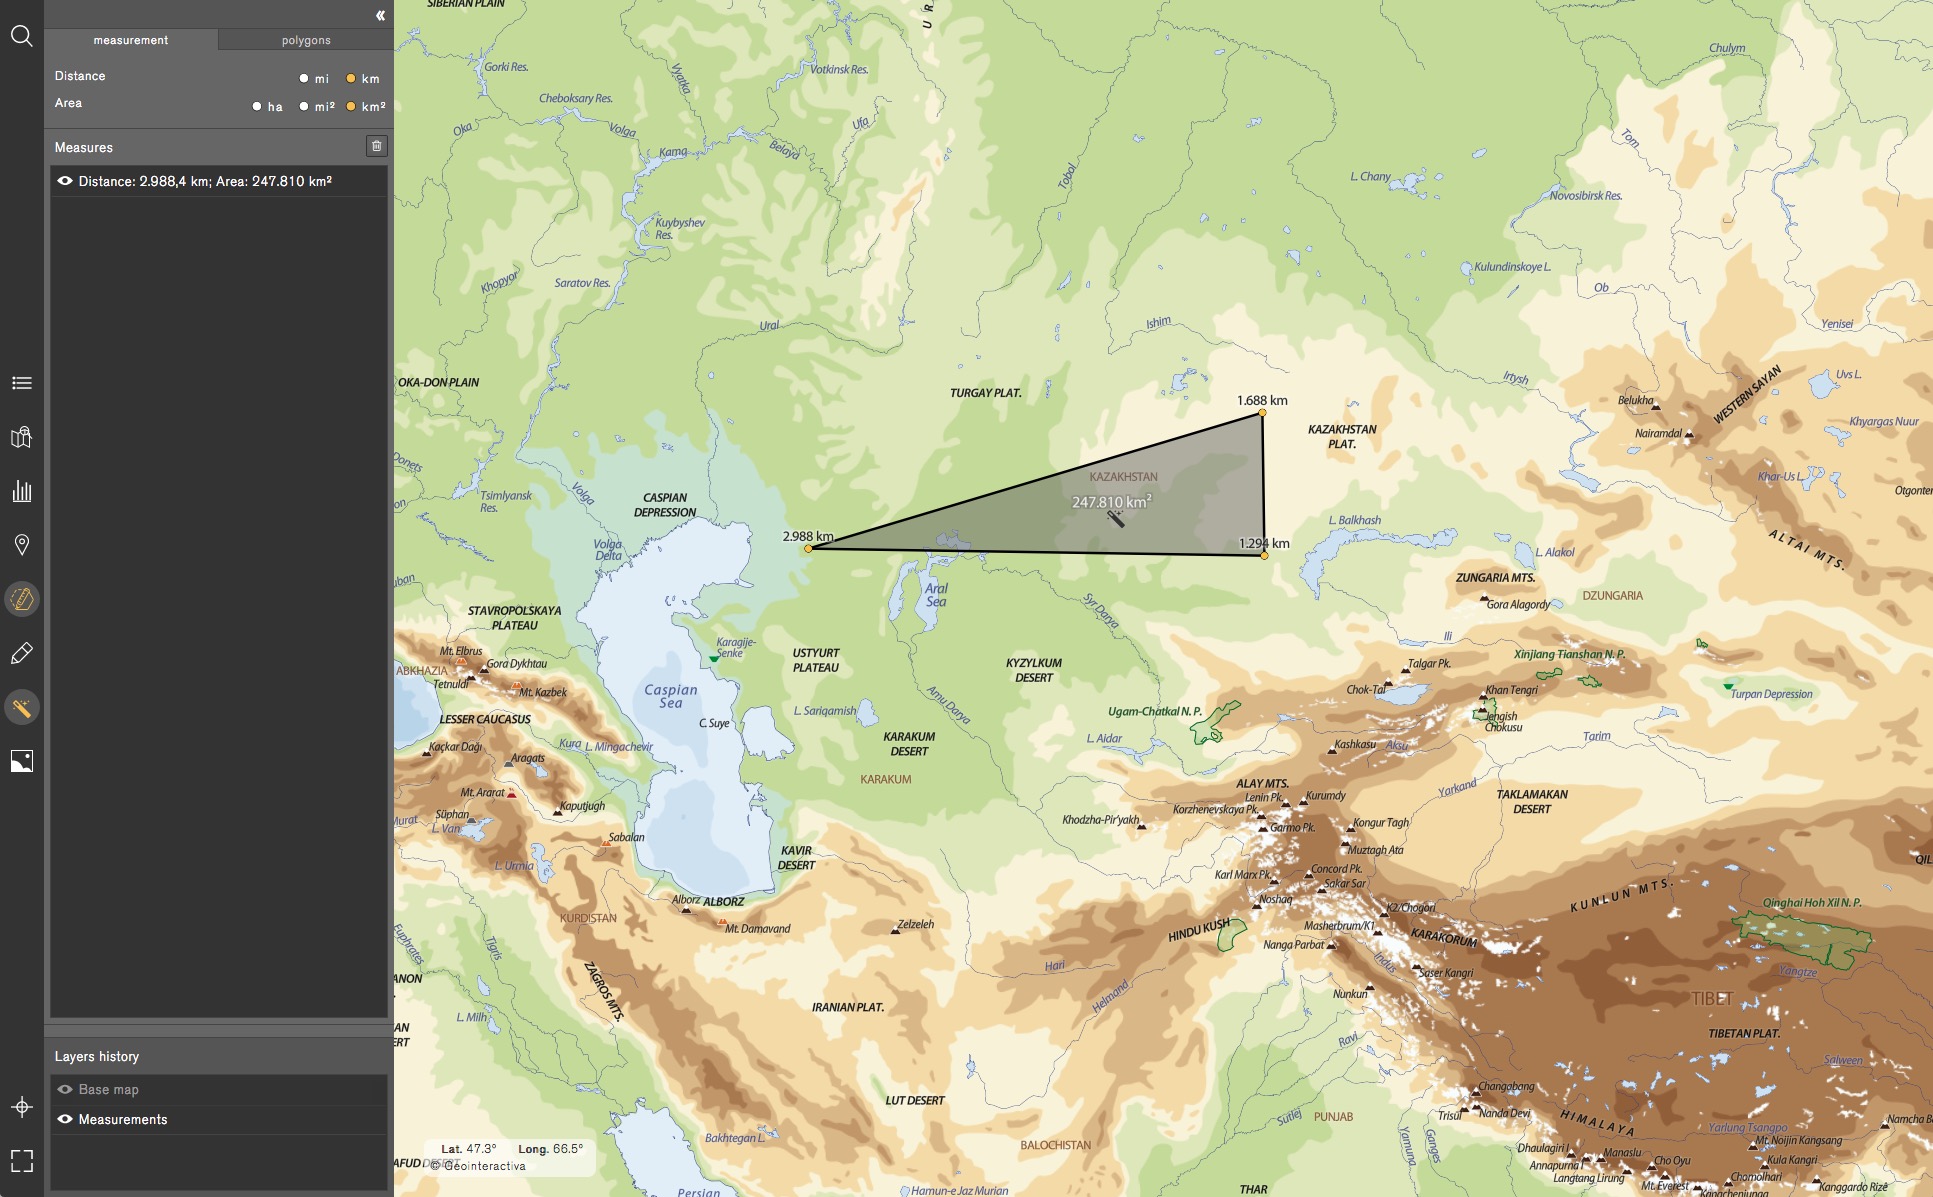
- Measurement: allows the user to measure distances or areas in straight lines by kilometres or miles. These can be stored/saved as objects in an interactive layer: Measure distances between populations, borders, routes, watercourses, as well as contours and areas of any surface.
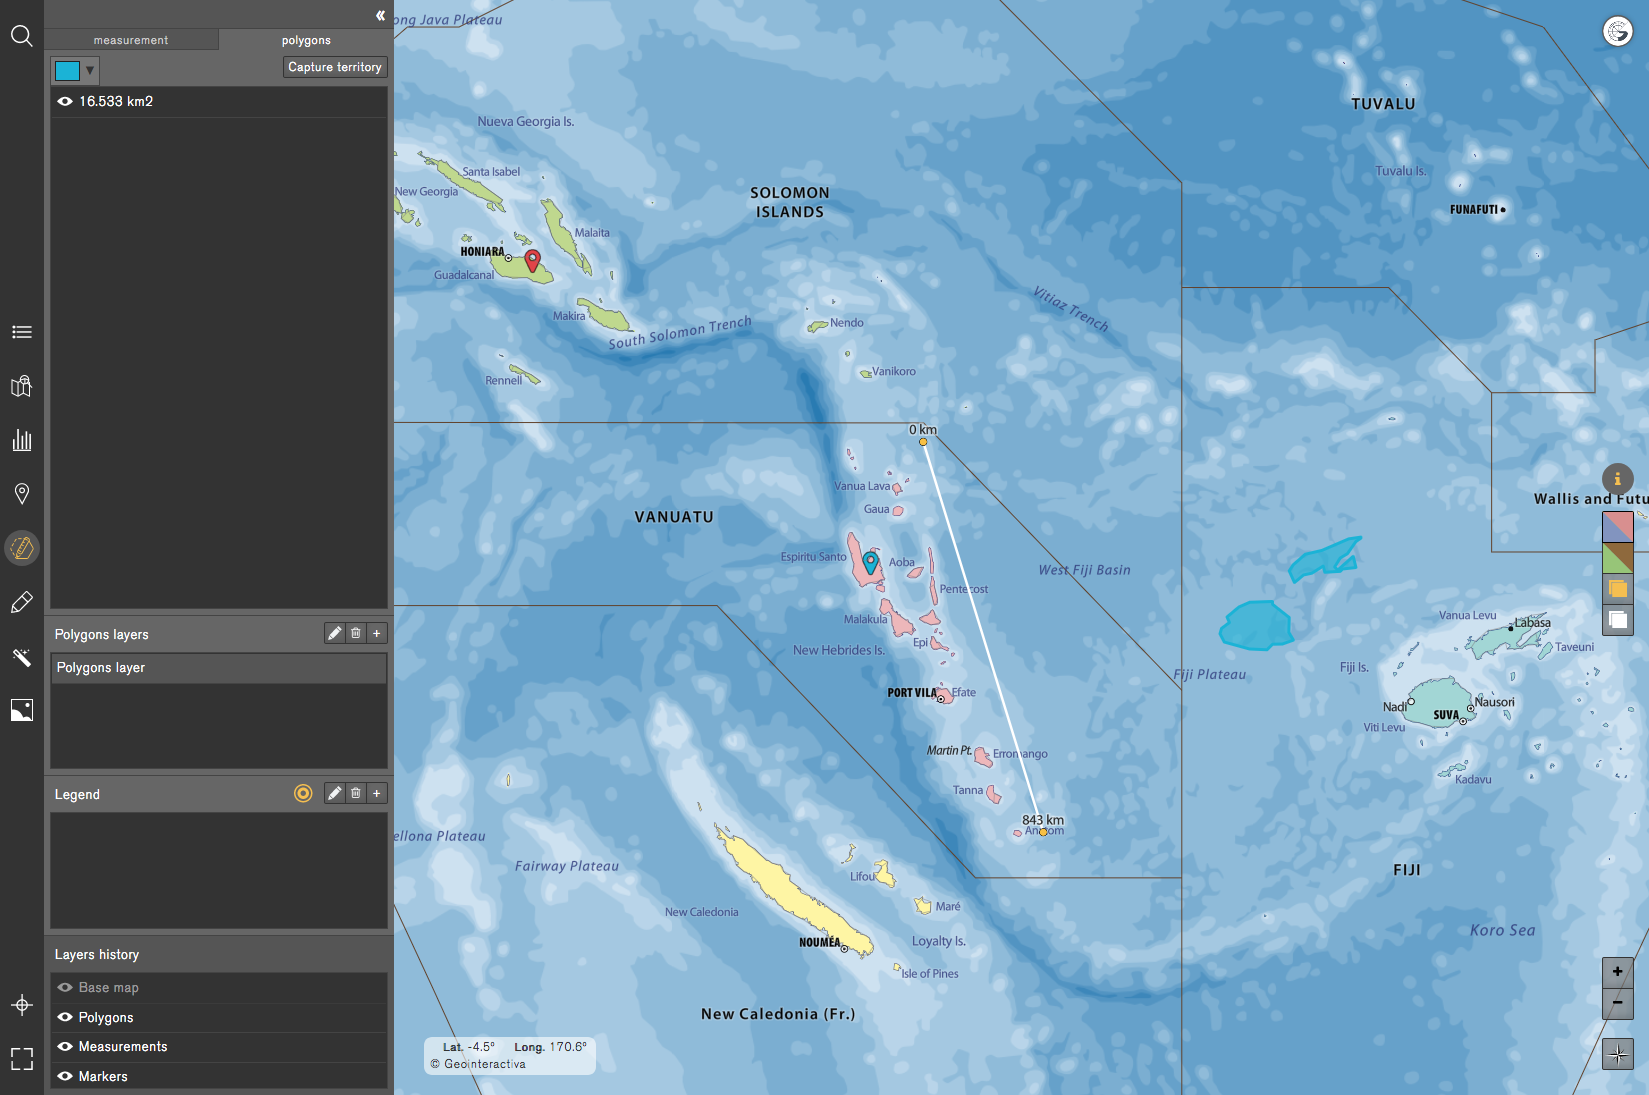
- Polygons: this tool allows you to create polygonal areas through the union of points. Also, the generated polygons act as a marker, so that they offer the same possibilities as this tool, that is, incorporate textual and multimedia content.
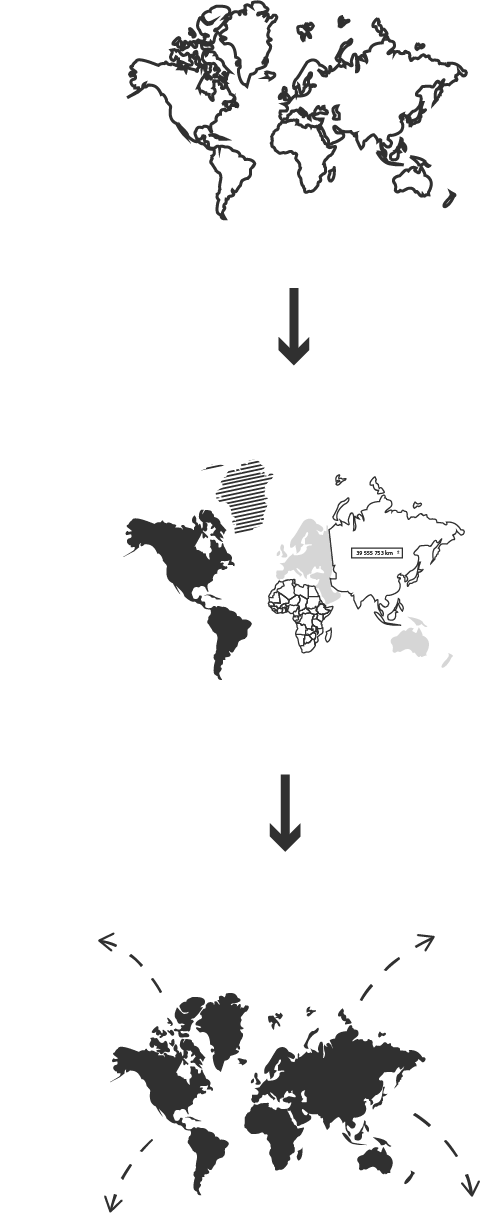
- Capture territory: with this tool you can compare the area and shape between two countries of distant latitudes with each other. Clicking on a country generates a duplicate of its area whose size varies as we drag it in latitude across the map. We will observe a distortion that occurs due to the Pseudomercator projection that we use in Geointeractiva maps. For example, dragging Greenland to an equatorial zone will considerably reduce its size and we will verify that its real area is equivalent to other equatorial countries of much smaller apparent size.
Markers
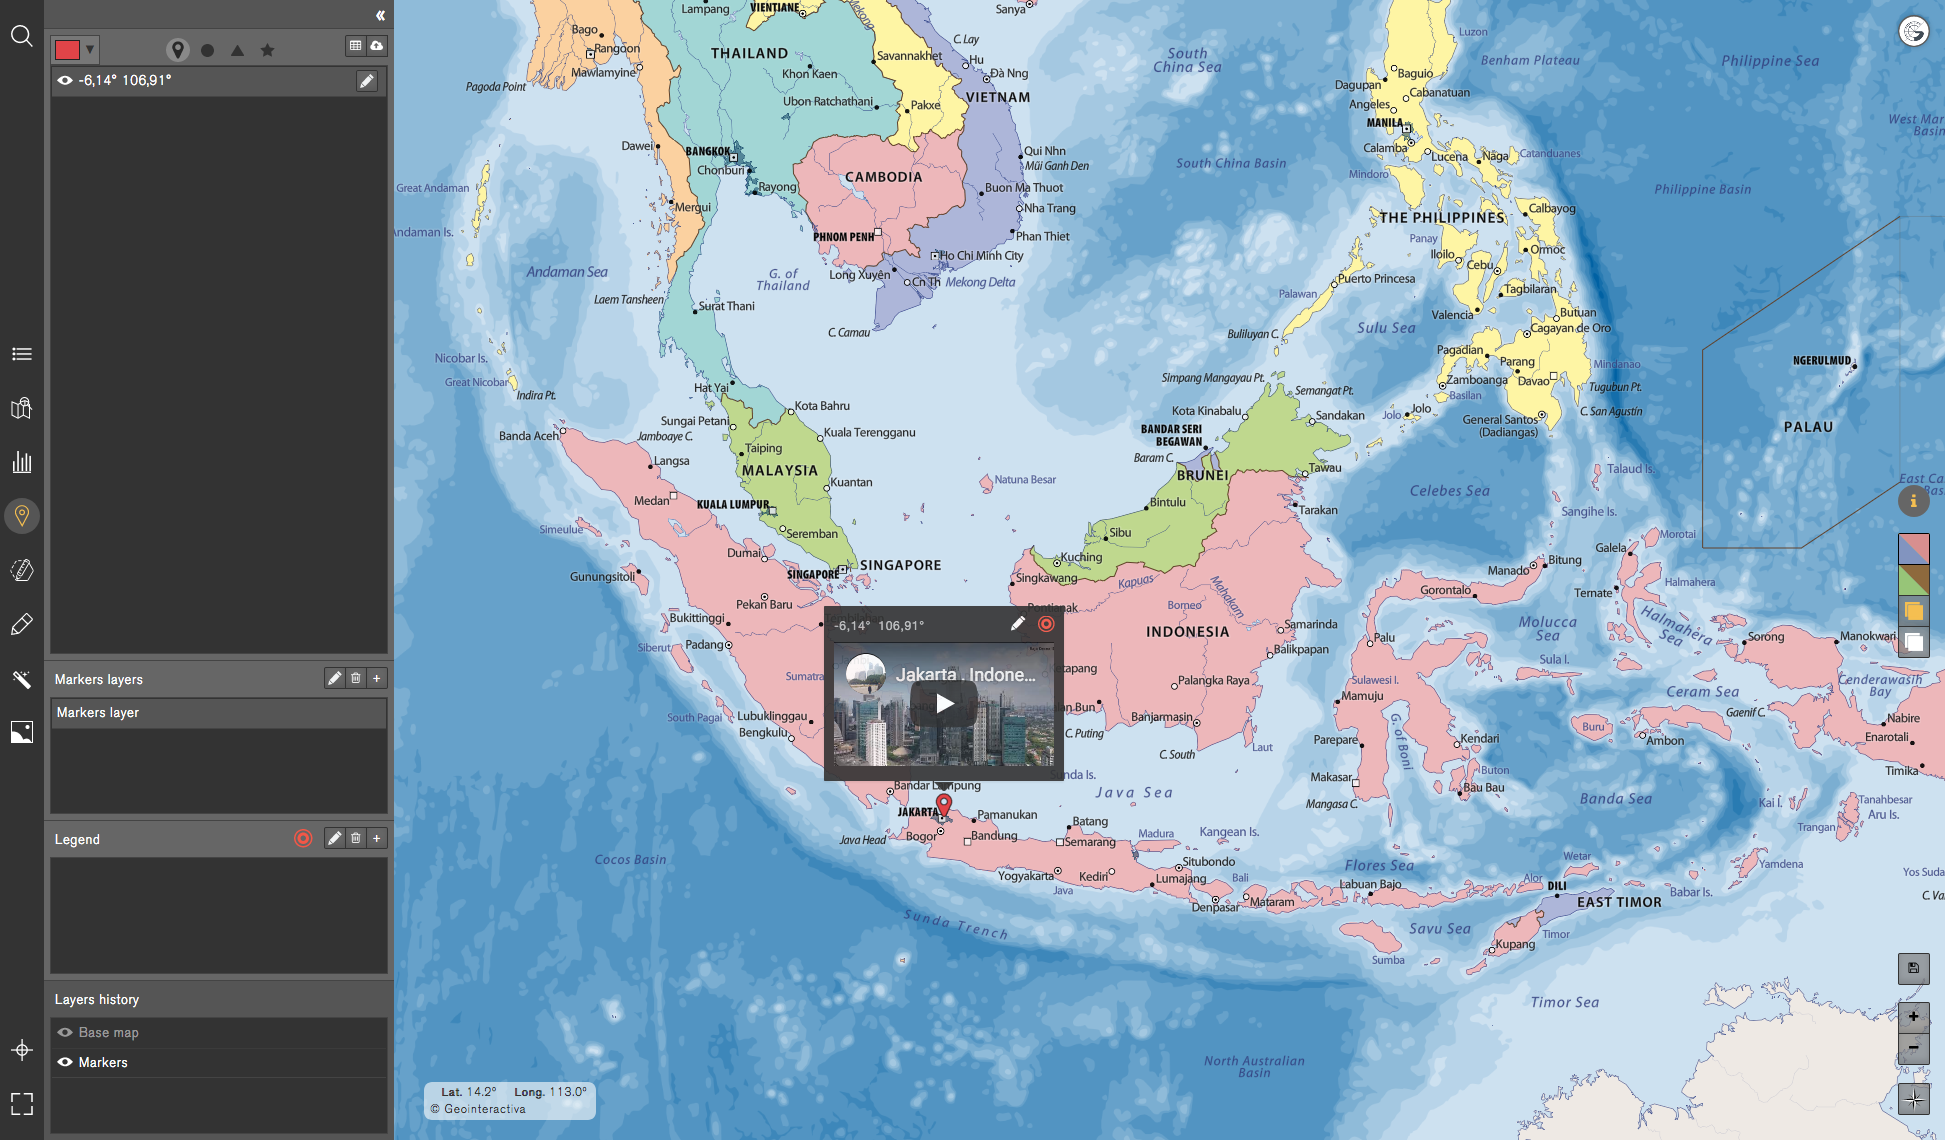
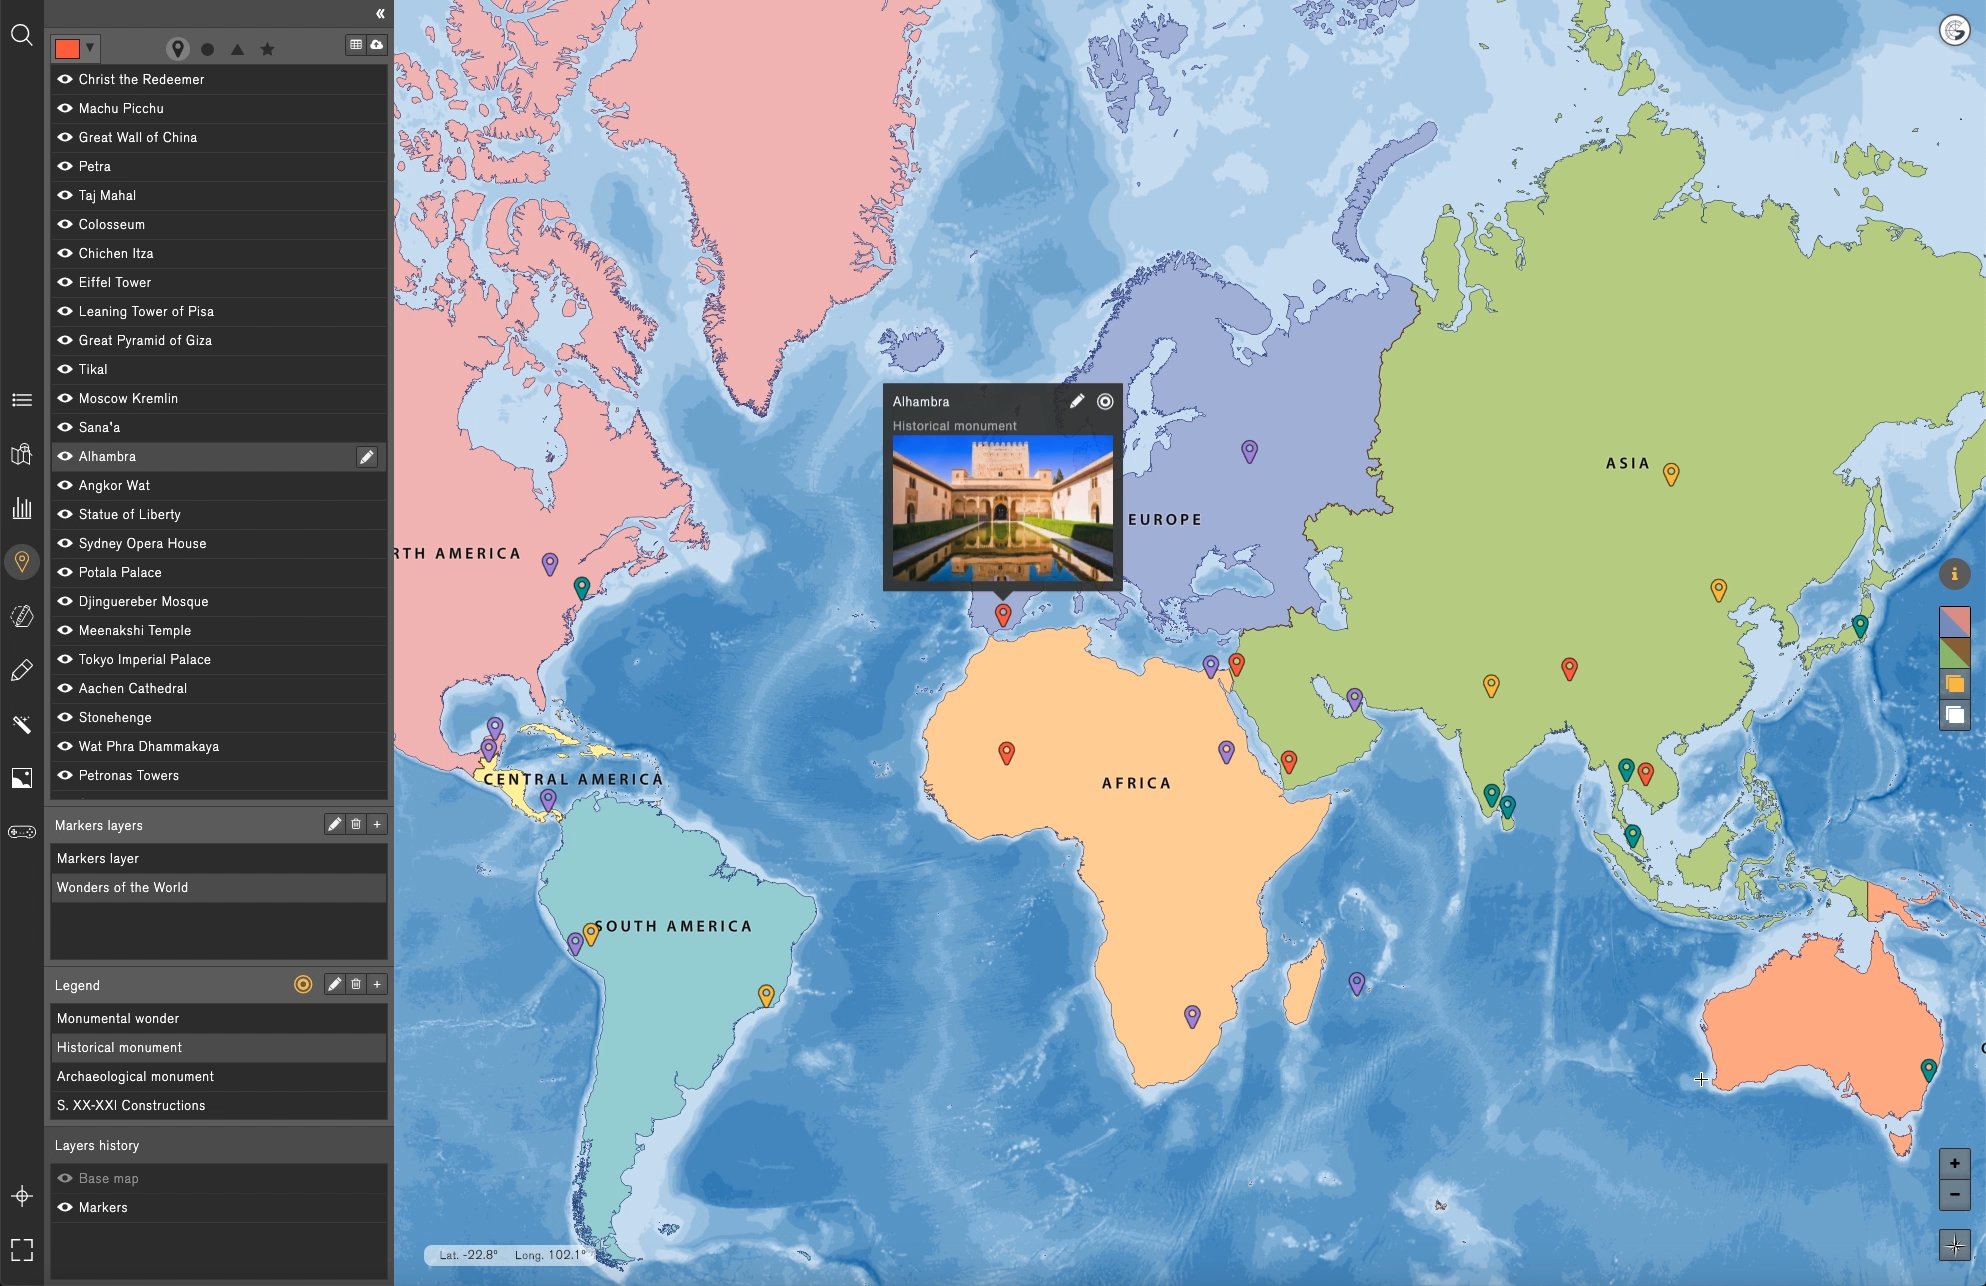
The Markers are a tool that allows the user to place georeferenced points anywhere on the map, and that can be enriched with textual and multimedia content (images, videos, links, etc.). In addition, we can make categories of markers that will be visible in the legend, and that are distinguished on the map by the color and shape of the icon.
There are three ways to generate markers:
- Individually: with the tool selected, clicking on the map will generate a marker.
- Using a table: at the top of the tool there is the option Import markers, which opens a table with the Latitude, Longitude, Title, Description and Legend fields. In this way we can fill the table with the number of markers we want or we can copy information from a spreadsheet and paste it into the table (the latitude and longitude fields are essential to be able to georeference a point, so that you always have to fill them).
- Import file: the last way is to import a file in CSV, KML or GPX format, which will instantly be loaded with all the information contained. Starting from a spreadsheet it is as simple as making five columns with the fields indicated above (Latitude, Longitude, Title, Description and Legend), fill in the information of each of them for each marker and select the option Save as, which will allow us to save the file in CSV format.
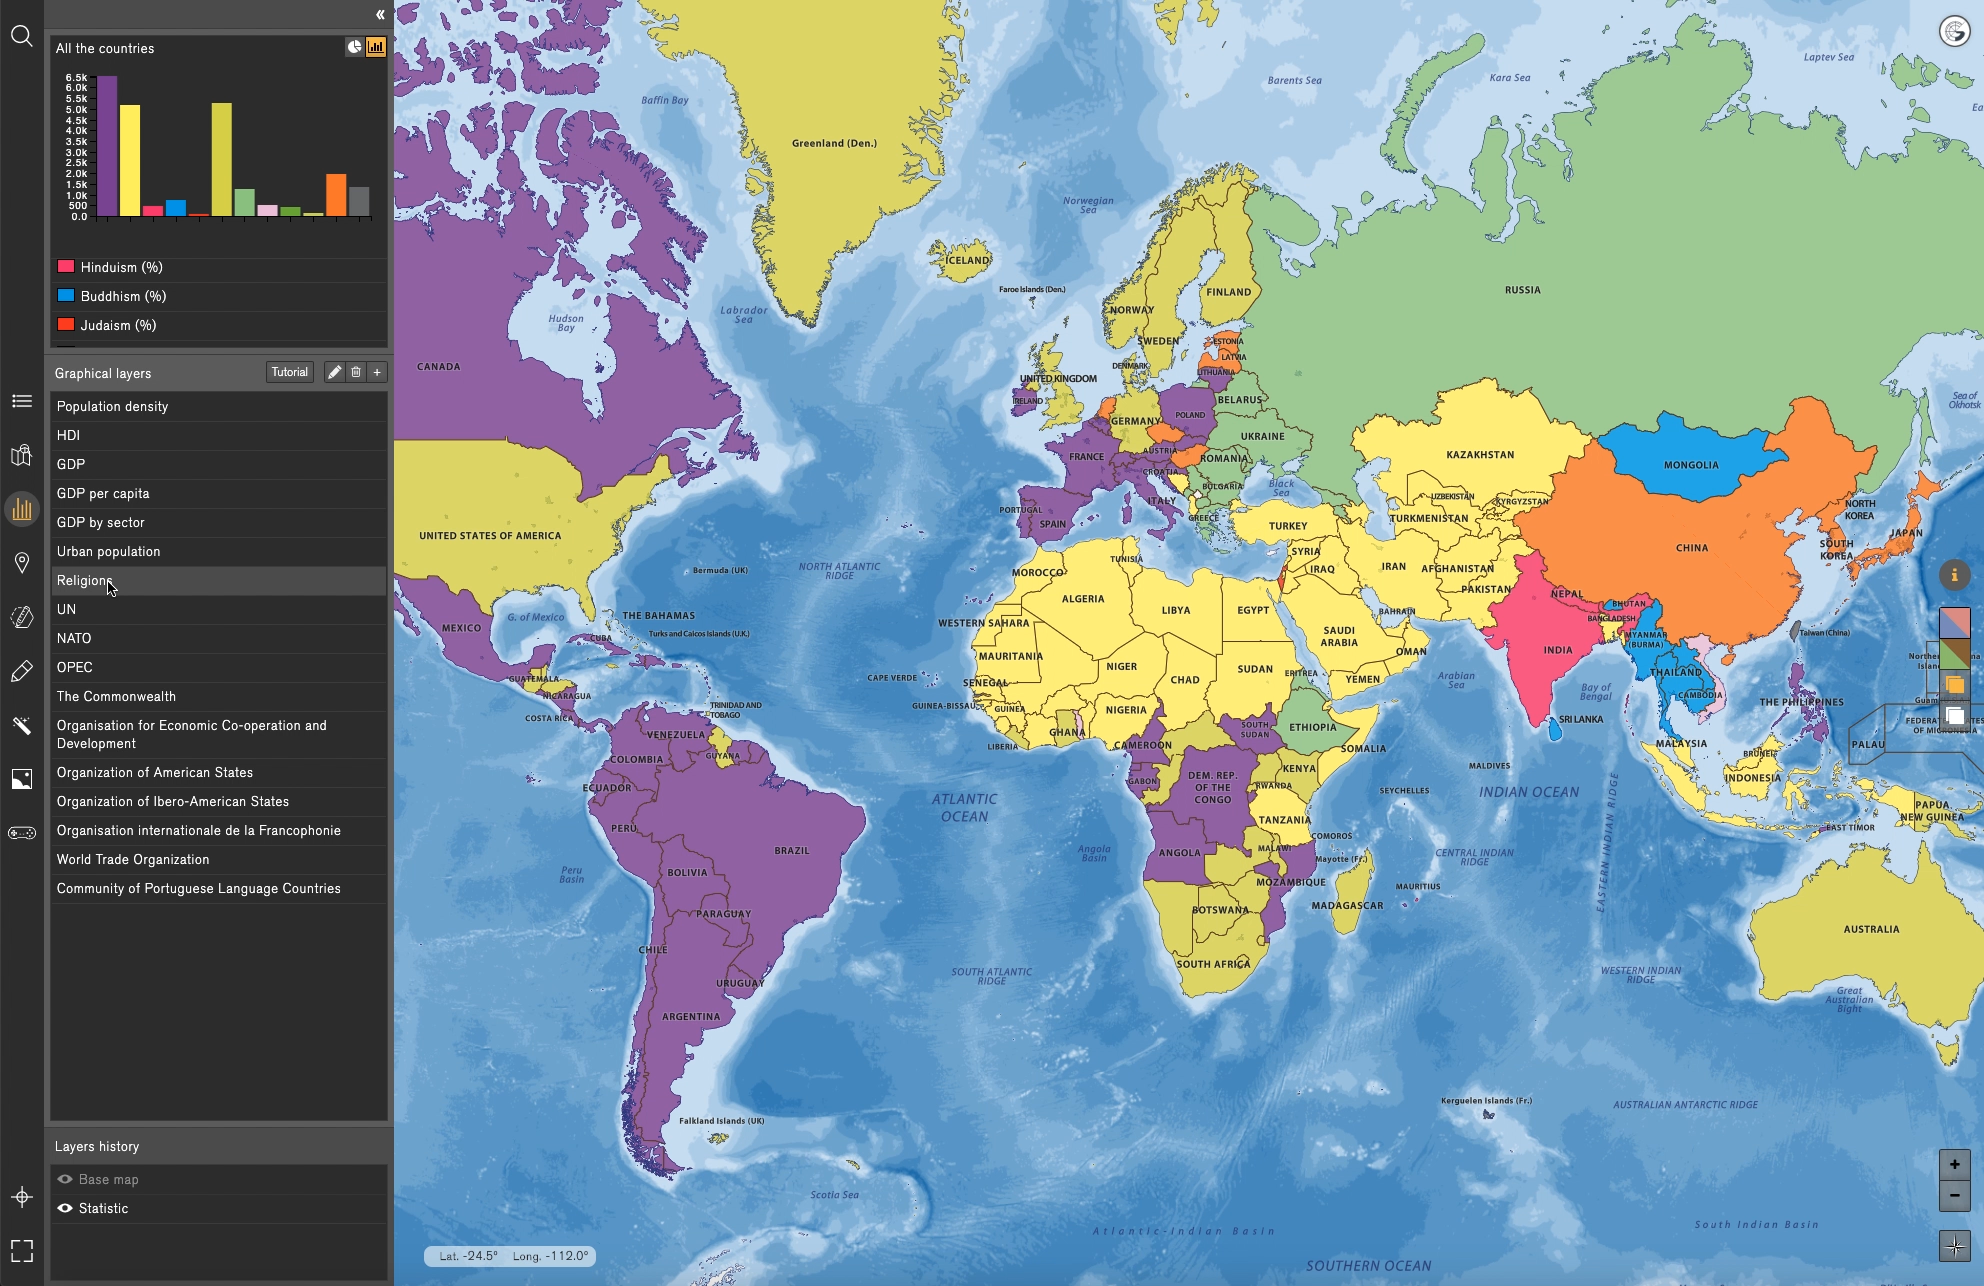
Statistical and Thematic Maps
The Statistical and Thematic Maps tool allows us to make qualitative graphics (thematic maps) or quantitative graphics (statistical maps). When selecting Create Statistical map or Create a thematic map, the Tools menu will be displayed where you can work the desired action. The maps offered by default make up a fundamental part of the product as they provide basic information on which we can observe the interaction of the human being with the territory, establish comparisons, postulate study and project hypotheses, as well as analyze causes and effects for the final adoption of informed and responsible criteria against the reality that economic and human geography exposes.
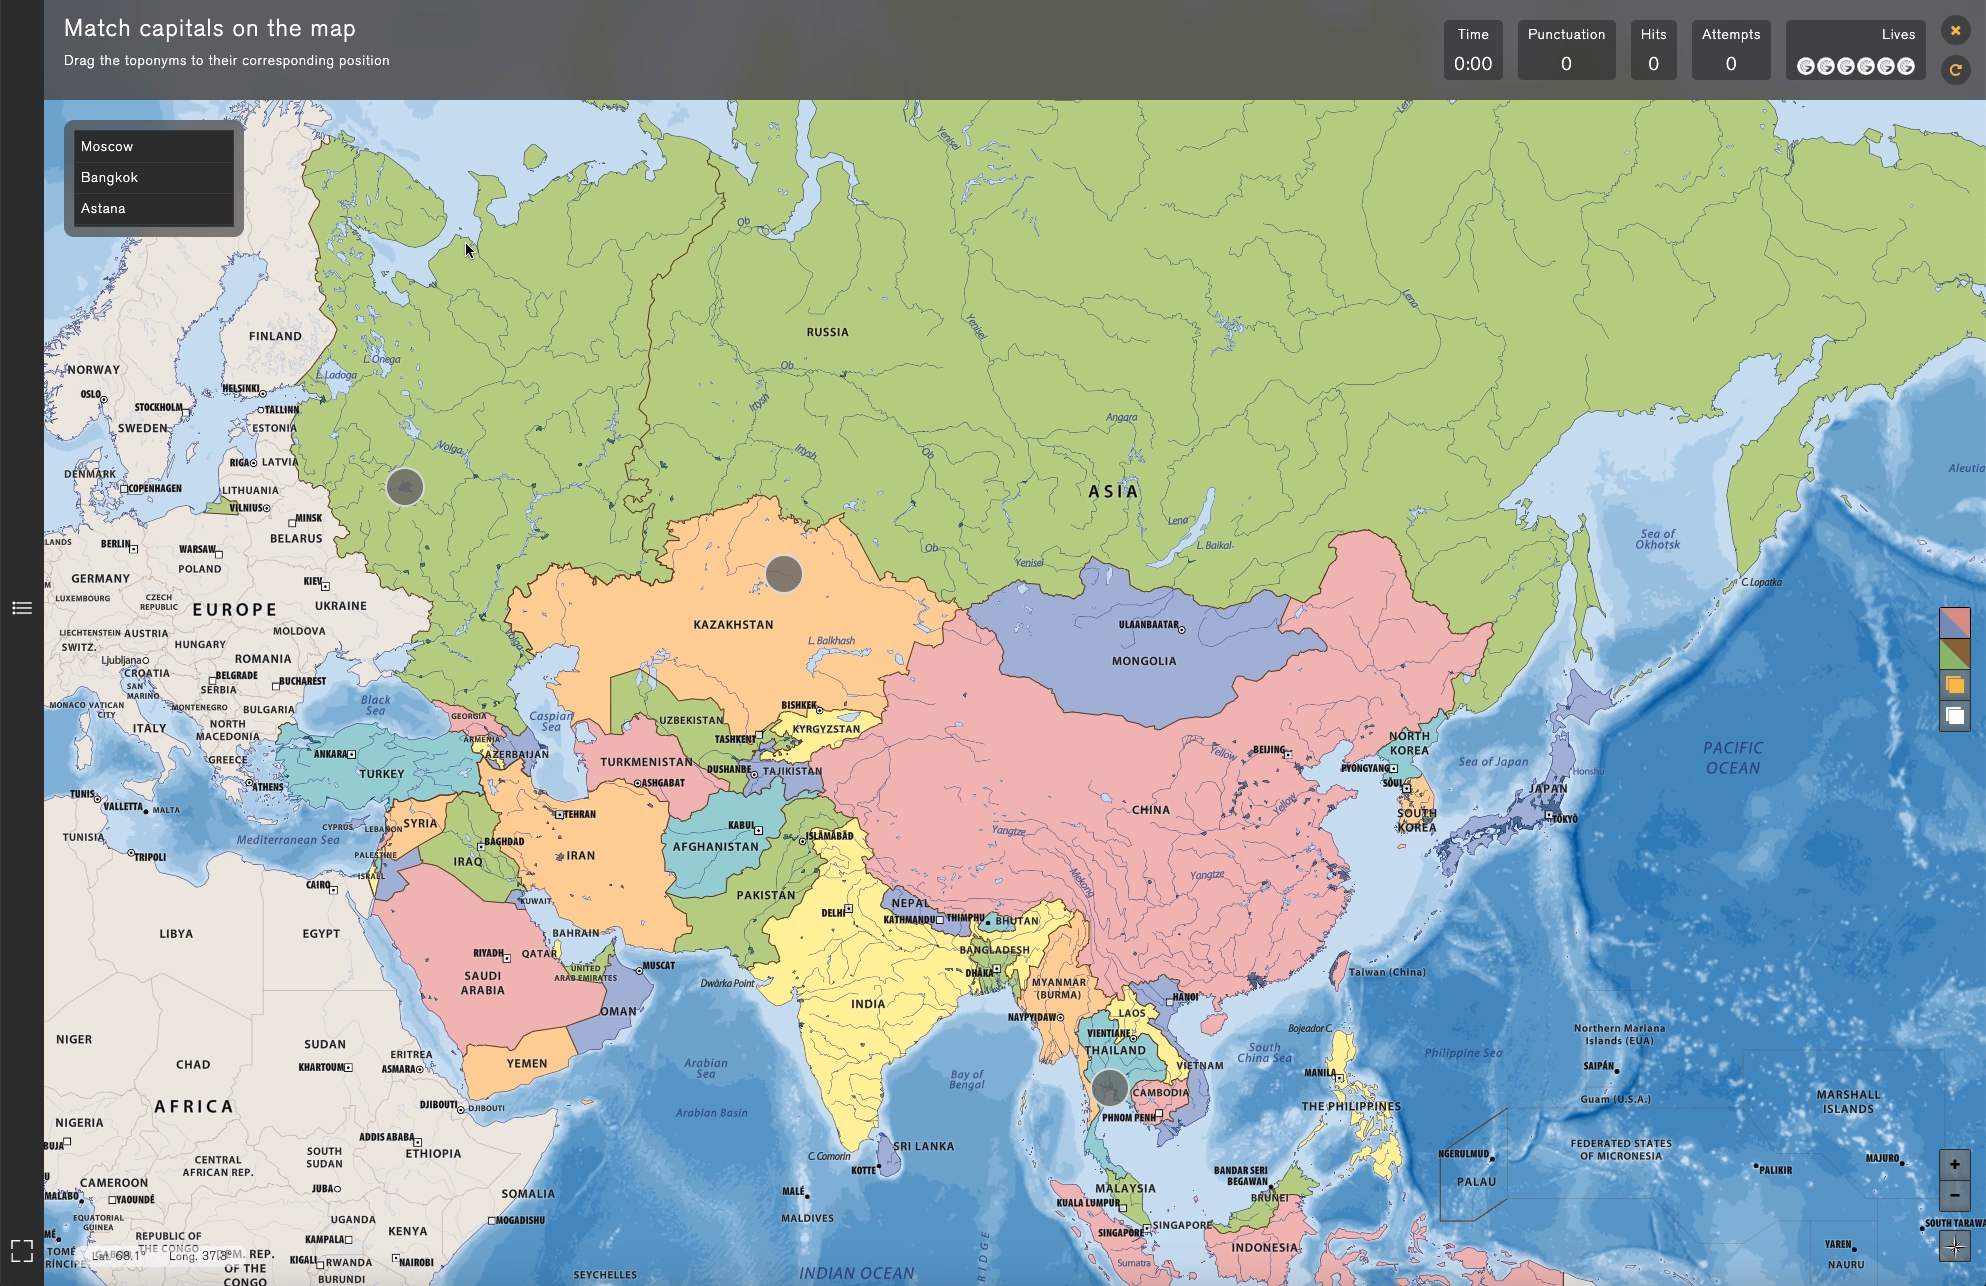
Games
Start playing with the default games or create them yourself. You can establish questions of physical and political layers of each of the maps or ask about statistical data from the statistical and thematic maps tool. There are three types of games:
- Drag toponyms and place them on the map
- Write toponyms
- Drag statistical data from data tables created by Geointeractiva or by the user
Eraser
The Eraser tool allows the user to eliminate any element of a map generated by the user.
Layers History
This tool is hosted in the Tools menu and lists the total number of layers displayed on the map in real time. It also lets the user interact with those layers by hiding or displaying different layers.
Geointeractiva app work areas
The app can be accessed online (Geointeractiva), either as a button or as a widget incorporated into the virtual space (such as Moodle) of any academic center (universities, schools, research centers, etc.). This function for virtual classrooms or intranets also facilitates access and integration of the app in the school and work environment.
The Geointeractiva app spaces are located on the right side of the app interface, unlike the functionalities or tools, which are located on the left side of the interface, that is, in the Tools menu.
Tools scheme
Interactive classroom
This space is located on the right side of the interface, in the Account space, and is designed so that Academic users (teachers and students, workgroups, etc.) can share maps and perform, for example, evaluations and tasks in group. In this space the courses included in an institution will also be displayed and within each course the user will be able to see and access the maps created and shared with him/her by an Admin user (as a teacher) of his/her institution.
The administrator roles are linked to this space since Admin users are able to create and edit groups (either subgroups of a class or classes, or entire groups), and include as many users as they want.
Account
My account is where the user can manage or modify its subscription, access to the maps, and the rest of the Geointeractiva environments such as the Interactive Classroom.
Maps
This menu stores and displays all the maps available for each subscription, as well as the maps saved by the user and/or shared with other users. The teacher, for example, will be able to select whether he wishes to keep a map private in his personal session, or otherwise if he wants to share it with the students through the Interactive classroom.
Profile
The Profile menu is where the user can edit his account details, personal payment details, or manage its subscription.
Technical scheme of the app
The database hosts different layers of maps, toponyms and statistical data, and runs in a Mapbox Vector Tile and JSON format. It also stores the user’s data as well as his custom maps.
The server has been developed in PHP and is an intermediary between the client and the database, managing the sessions of each user.
The client viewer has been developed in HTML5 and Javascript, and it connects securely (HTTPS) to the Geointeractiva server to download the layers that are displayed in the client app.
The programming team has willed to ease and enhance the application trying to offer a fast loading of all graphic and alphanumeric information, and smooth navigation through maps with the mouse scroll or when zooming into the map.
Geointeractiva uses WebGL as a rendering engine: it allows the user to view hardware rendered graphics, which improves the application performance. In addition, the app works with all current browsers, without requiring any plugins or external complement.
Maps are exported in vector format (MapBox Vector Tile). Vector graphics are superior to pixel or bitmap image format and allows the optimization of the maps interactivity.
The structure for the cartographic bases are vector source type which makes it possible to combine the graphic precision with their different scale variations depending on the geographical coverage represented: the world, continents, countries, regions, etc.
Cartographic information has been adjusted, processed and composed using various geographic information systems (GIS) and mapping specific applications implemented in vector drawing programs.
The maps territorial bases have been obtained from a public domain site, Natural Earth Data. All vector data are seamlessly integrated into our application and the scale basis used is 1 : 10 000 000.
Databases are georeferenced using WGS84 as datum, or origin of the geographic coordinates, and are reprojected on each map by a Mercator projection derivation: the Pseudomercator (EPSG: 3857). This projection coordinates system is used to render maps in most of web cartographic applications.
The Pseudomercator projection uses the spherical development of ellipsoidal coordinates, with an area of use that goes between 85.06º North and 85.06º South, and has two main coordinate axes: the Greenwich meridian and the Equator. Cylindrical projections allow to plan North-South and East-West routes in straight lines (vertical or horizontal). It also allows to plan rhumb lines (loxomodric routes) allowing to maintain a constant course in the navigation; every planned course appears like a straight line in the map and the same way it maintains the forms and the angles of the different elements represented in the terrestrial surface.
The graphic content is structured in different layers of information divided into thematic map areas: physical, political, thematic, statistical. Optionally, layers can also display maps from external bases (mainly Open Source: OpenStreetMap, Openweathermap, NASA Cartography, Stamen Design maps, etc.).
Willing to create a tailor-made experience, the application offers the ability to import georeferenced data in CSV, GPX or GPS format in order to allow the user the display of statistical data, routes or markers routes; geolocate and display on the maps any saved route with assigned geographic coordinates.
Geointeractiva runs with a database of over 70,000 toponyms and records that are constantly updated and expanded. Most of this data comes from the GeoNames database (www.geonames.org) after selection, processing and integration by the Geointeractiva team, as well as studies of quantitative data (statistics) from government institutions and departments, and local, regional, national and international associations and entities.
Users according to subscription
Types of users
The individual user can access all Geointeractiva maps but at the moment cannot share them with other users. (Later, he’ll be able to share them with any Geointeractiva user). Users with an Individual Plus subscription can also manage roles (admin*) to use the Interactive Classroom, with a limit of three users in every shared session.
These subscriptions respond to linked accounts for thirty or more users with a shared profile and are intended for academic and professional groups. With the Academic subscription users can enable a group of up to thirty + teacher shared profile users. Academic Plus subscriptions can generate as many account profiles as the user has acquired with Geointeractiva, in a personalized and tailored way.
- Interactive Classroom: In the Account space, users with an Academic subscription will find this option. In this space the courses that your institution understands will be displayed and within each course you will be able to see and access the maps that any Admin of your institution has created and appointed.
- Admin/Superadmin: The types of administrators have been created to grant a management role to the institutions/entities comprising a centers’ community. In this way I can choose and edit what centers will have the option of using the Geointeractiva app; those teachers who generate activities in the Interactive Classroom will be able to select the users, classes and courses with which they wish to share the current sessions or the created maps.
Admin & Super admin*: The types of role administrators have been created to give to the institutions/entities an account profile managing tool. In order to ease the junction between the professors and students networked in the same academic center. Those Admins who wish to share maps through the Interactive Classroom can select the users, classes, courses, or centers, with which they want to share the sessions or the maps created in the Geointeractiva app.
