high school (+16 años)
The GDP and activities with maps.
In this activity, you will learn how statistical maps are valuable tools in geography and economics, as they allow you to visualize complex data in a clear and easily understandable way.
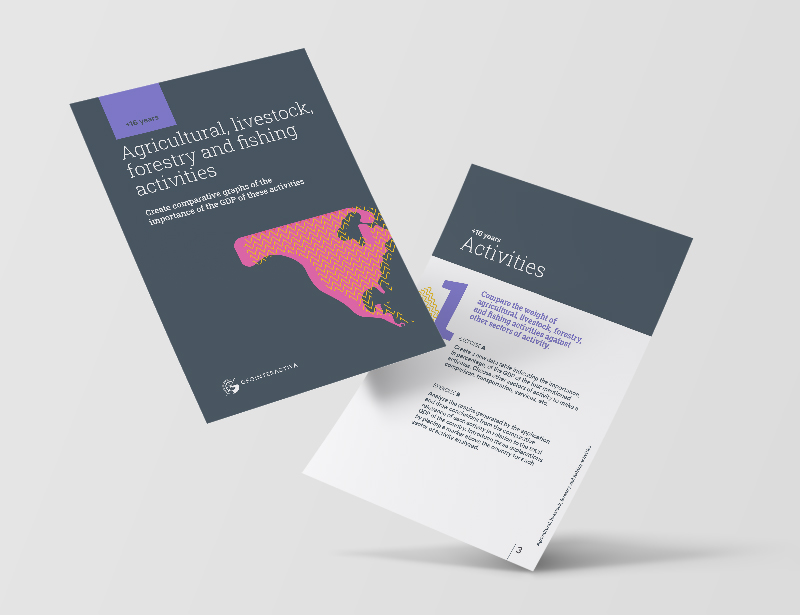
In this downloadable, you will find a PDF resource with instructions to liven up your classes. On one hand, we show you which platform tool you will be working with, and on the other hand, we offer activities suitable for students over 16 years old.
Do you want your classes to be stimulating? Start today with Geointeractiva.
we suggest teaching geography in a fun way
What will your students learn from this educational activity?
The GDP and activities with maps
Statistical maps are valuable tools in geography and economics as they allow complex data to be visualized in a clear and easy-to-understand way. In this article, we will focus on maps that represent the weight of agricultural, livestock, forestry, and fishing activities on the total GDP. These activities are fundamental in the economy of many countries and can have a significant impact on their economic and social development.
What are agricultural, livestock, forestry, and fishing activities?
Agricultural, livestock, forestry, and fishing activities are those sectors that are dedicated to the production of food and basic products for society. Agricultural activities refer to the production of crops and food, such as fruit and wheat, while livestock activities are dedicated to the production of meat and milk. On the other hand, forestry activities focus on the production of wood and derived products, and fishing activities are dedicated to the capture of fish and seafood.
What are statistical maps?
A statistical map is a graphical representation of geographic or socioeconomic data. These types of maps can display information such as population density, per capita income, literacy rate, or the percentage of the total GDP represented by agricultural, livestock, forestry, and fishing activities. Statistical maps often use different colors or symbols to represent differences in geographic data. These maps can be very useful for visualizing patterns or trends in the data.
Why is it important to know the weight of these activities on the total GDP?
The weight of agricultural, livestock, forestry, and fishing activities on the total GDP can have a significant impact on the economic and social development of a country. In some countries, these activities are the main source of employment and generate a large amount of income for the economy. In other countries, the weight of these activities may be lower, but it remains important for the economy and society.
Examples of statistical maps
Below are some examples of statistical maps that show the weight of agricultural, livestock, forestry, and fishing activities on the total GDP in different countries:
Brazil: Agricultural activity is one of the main sources of income in Brazil, representing around 5% of the country’s total GDP. In statistical maps of Brazil, it can be observed how agricultural activity is mainly concentrated in the central-west and southern regions of the country.
Canada: In Canada, forestry activity is one of the main sources of income in some regions, representing up to 20% of the total GDP. Statistical maps of Canada show how forestry activity is concentrated in the province of British Columbia, on the west coast of the country.
Norway: In Norway, fishing activity is one of the main sources of income, representing around 5% of the total GDP. Statistical maps of Norway show how fishing activity is mainly concentrated on the northwest coast of the country, where the sea conditions are more favorable for fishing.
Argentina: Livestock activity is one of the main sources of income in Argentina, representing around 2% of the country’s total GDP. Statistical maps of Argentina show how livestock activity is mainly concentrated in the northern and southern regions of the country, where bovine livestock is the most common activity.
Conclusions
In conclusion, statistical maps are very useful tools for visualizing the weight of agricultural, livestock, forestry, and fishing activities on the total GDP in different countries. These activities are fundamental to the economy and society of many countries and can have a significant impact on their economic and social development. Through statistical maps, we can observe how these activities are geographically distributed and how they contribute to the economy of each country. Knowing this information can be very valuable in understanding the reality of each country and making economic and political decisions.