Committed to
educational change
Committed to
Educational
Change
didactic basis of our interactive maps
The user is the protagonist of his own learning
The intuitive design and use of the application together with the extensive content that allows the possibility of updating and expanding it make Geointeractiva an easily accessible resource even for the smallest!
We unite geography social sciences and history in a single tool with multiple possibilities.
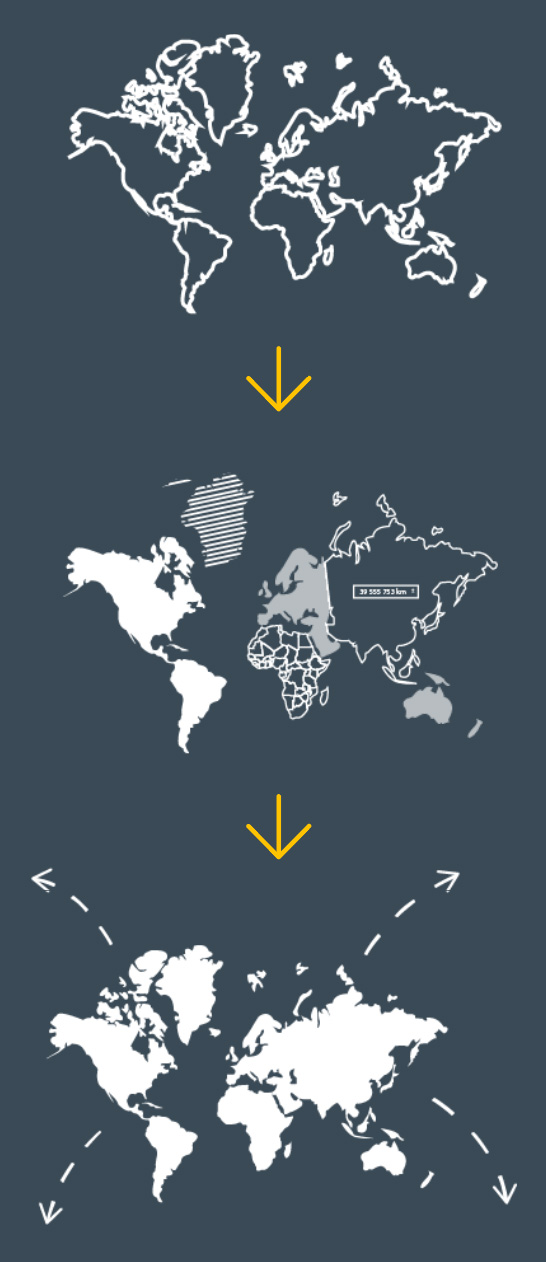
Interactive maps go far beyond traditional geography. You can create your own historical maps visualize statistics about countries or regions or make a specific combination of layers to draw conclusions about human interaction with the territory.
Involvement and curiosity instead of memorization
Memorizing content and writing it down on exams should be a thing of the past. We propose to learn to visualize the content according to the user’s preferences.
If in addition to learning with our interactive maps you want to have a good time you can test yourself with the didactic games we have prepared.

Tailor-made maps
Create edit and share your own interactive maps
The app has a menú of tools to configure and edit the maps hosted on it; you can draw lines and polygonsplace markers (geolocated enclaves) or insert your images and styles to transform the map and customize it to your liking.
The maps created by Geointeractiva are visualized through a layered structure in which each physical or political element can be activated or deactivated depending on the interaction required by the user. You can elaborate a map and combine the desired information using layers and sublayers that allow you to show or hide any area of the map.